As a siding contractor, you constantly juggle new and current projects, look for new clients, and update your website. Why not use Google Analytics to its full potential to help? Google Analytics has a plethora of features and metrics that you can use to optimize your website to gain insight into how to improve your website conversions.
Let’s dive into the features and metrics on Google Analytics that matter the most to siding contractors.

Setting Goals in Google Analytics
The first step is to set goals for your siding contractor business in Google Analytics, which allows you to track your website visitors’ behaviors and measure conversions. A conversion occurs when a website visitor performs a desired action, such as signing up for your newsletter, clicking through to your product pages, or filling out a contact form for a free siding quote.
Sign in to Google Analytics, click on the Admin page, and click on Goals under the View column. Click on “New Goal,” title the goal, and determine the goal type. Duration (the length of a visit on a website page), pages per session, destination (pageviews on particular pages), or a specific event (clicks, downloads, etc.) are all examples of goal types.
Next, you’ll want to learn more about the different metrics applicable to siding contractors that you’ll have access to in Google Analytics.

Understanding Metrics in Google Analytics
Here are the most important metrics in Google Analytics for siding professionals:
Users
Users are the number of people who visit your website within a specific frame of time.
Sessions
Sessions can be thought of as website visits. These are not the same as the number of users; if one person visits your website multiple times, it counts as multiple sessions.
Average Session Duration
Average session duration measures the amount of time website visitors spend on your website.
Pageviews
Pageviews are specific to particular pages, or URLs, and measure how many times a particular page has been viewed, including repeat visits.
Unique Pageviews
Unique Pageviews takes it a step further. If someone views the same website page multiple times during the same session, Unique pageviews counts that as one pageview.
Pages per Session
Often referred to as “average page depth”, this is the number of pages viewed per session. Pages per session gives you a better idea of engagement on your pages.
Bounce rate
Google defines a bounce as a single-page session. This means instead of staying on the website and continuing with an action, the website visitor immediately clicked away or closed the window on a single page. Bounce rate is a percentage that is calculated by taking the total number of single-page sessions (bounces) and dividing by all sessions.
Once you understand what the different metrics indicate, you can begin to ask questions like; are new website visitors spending more time on your website than returning visitors, and which website pages are driving the most conversions?
Now that we’ve gone over some of the most important metrics, let’s talk about the Google Analytics features you can use.
Features on Google Analytics That You Should Be Using
As you get used to Google Analytics, try using the following helpful features:
Audiences
On the left-hand side of your Google Analytics dashboard, you’ll find the Audiences tab. Click on it to open up a drop-down, where you’ll find various ways to analyze your website visitors, including demographics, interests, location (geo), devices (desktop/mobile), etc. For example, clicking on Demographics shows you the age and gender of your website users.
Click on Behavior and then on Engagement to see a breakdown of sessions, page views, and session duration; this is a breakdown of how long visitors stay on your pages.
Behavior
Go back to the left-hand side of the dashboard and click on Behavior. Click on Site Content and then on All Pages to see the top pages of your website. You’ll see which websites are getting the highest page views and unique pageviews. Seeing which pages drive the most engagement helps you understand your target audience and lets you see which pages are the most valuable.

Traffic Sources & Social Reports
On the left side of the dashboard, navigate to Realtime and then to Traffic Sources. You can find insight into where real-time traffic is coming from. Here are some of the types of traffic sources you’ll come across:
- Organic Search - This is traffic coming to your website directly from Google/ When someone types in an organic search term like “home siding contractors in Los Angeles,” they come to your website from the organic search results.
- Social Traffic - Social traffic consists of website visitors coming to your website via social media platforms like Facebook, Instagram, and Pinterest.
- Referral Traffic - Website visitors who have arrived directly from another website are referral traffic. This includes users who clicked through to your website from Yelp or Home Advisor.
- Email Traffic - If you have an email blast or newsletter directing people to your website, you’ll be able to view that specific traffic as well.
Data Studio
Don’t forget to look at Data Studio. Go to Customization on the left-hand side, and then Dashboards. You’ll see a banner about Data Studio with links to Audiences Overview, Acquisitions Overview, and Behaviors Overview. These are interactive reports that can be tailored for your easy review. For example, in the Acquisitions Overview, you’ll be able to filter by region, channel, device and time period. Scroll to the bottom to see the Source / Medium that traffic is coming from, and you’ll also see specific domains and social media channels.
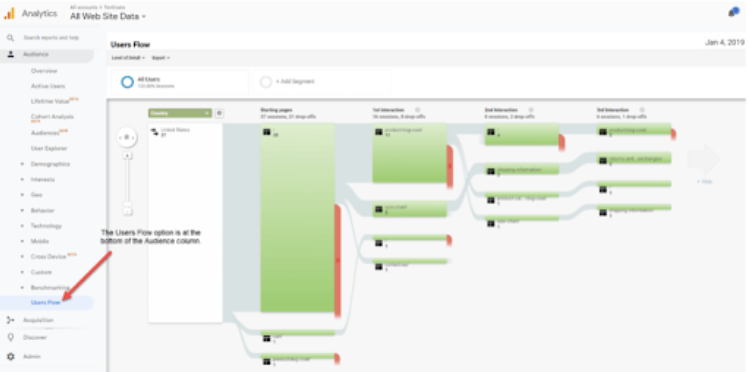
Flow Visualization Reports
You can use this Google Analytics feature to track the customer’s journey through your site. A flow visualization illustrates the “path” that visitors take through your site. You can use flow reports to track how many users exit your website between steps, check traffic from specific sources or campaigns, and see where users are backtracking. Once you understand how customers are leaving the path, you can take informed actions to remedy it.
Use Google Analytics to Grow Your Contracting Business
With practice, you’ll get used to these features and find even more. Don’t forget to link your Google AdWords account to your Google Analytics account. Then you can see metrics in your AdWords account and be able to view customer activity after a visitor clicks an ad.
Tracking metrics on Google Analytics will reveal what is working and what isn’t working to engage new clients and sign them up for siding installation.
As a result, you’ll be able to determine if you are meeting your goals, get some valuable insight on how to improve your website and multi-channel marketing efforts, and see more return on investment in your website.